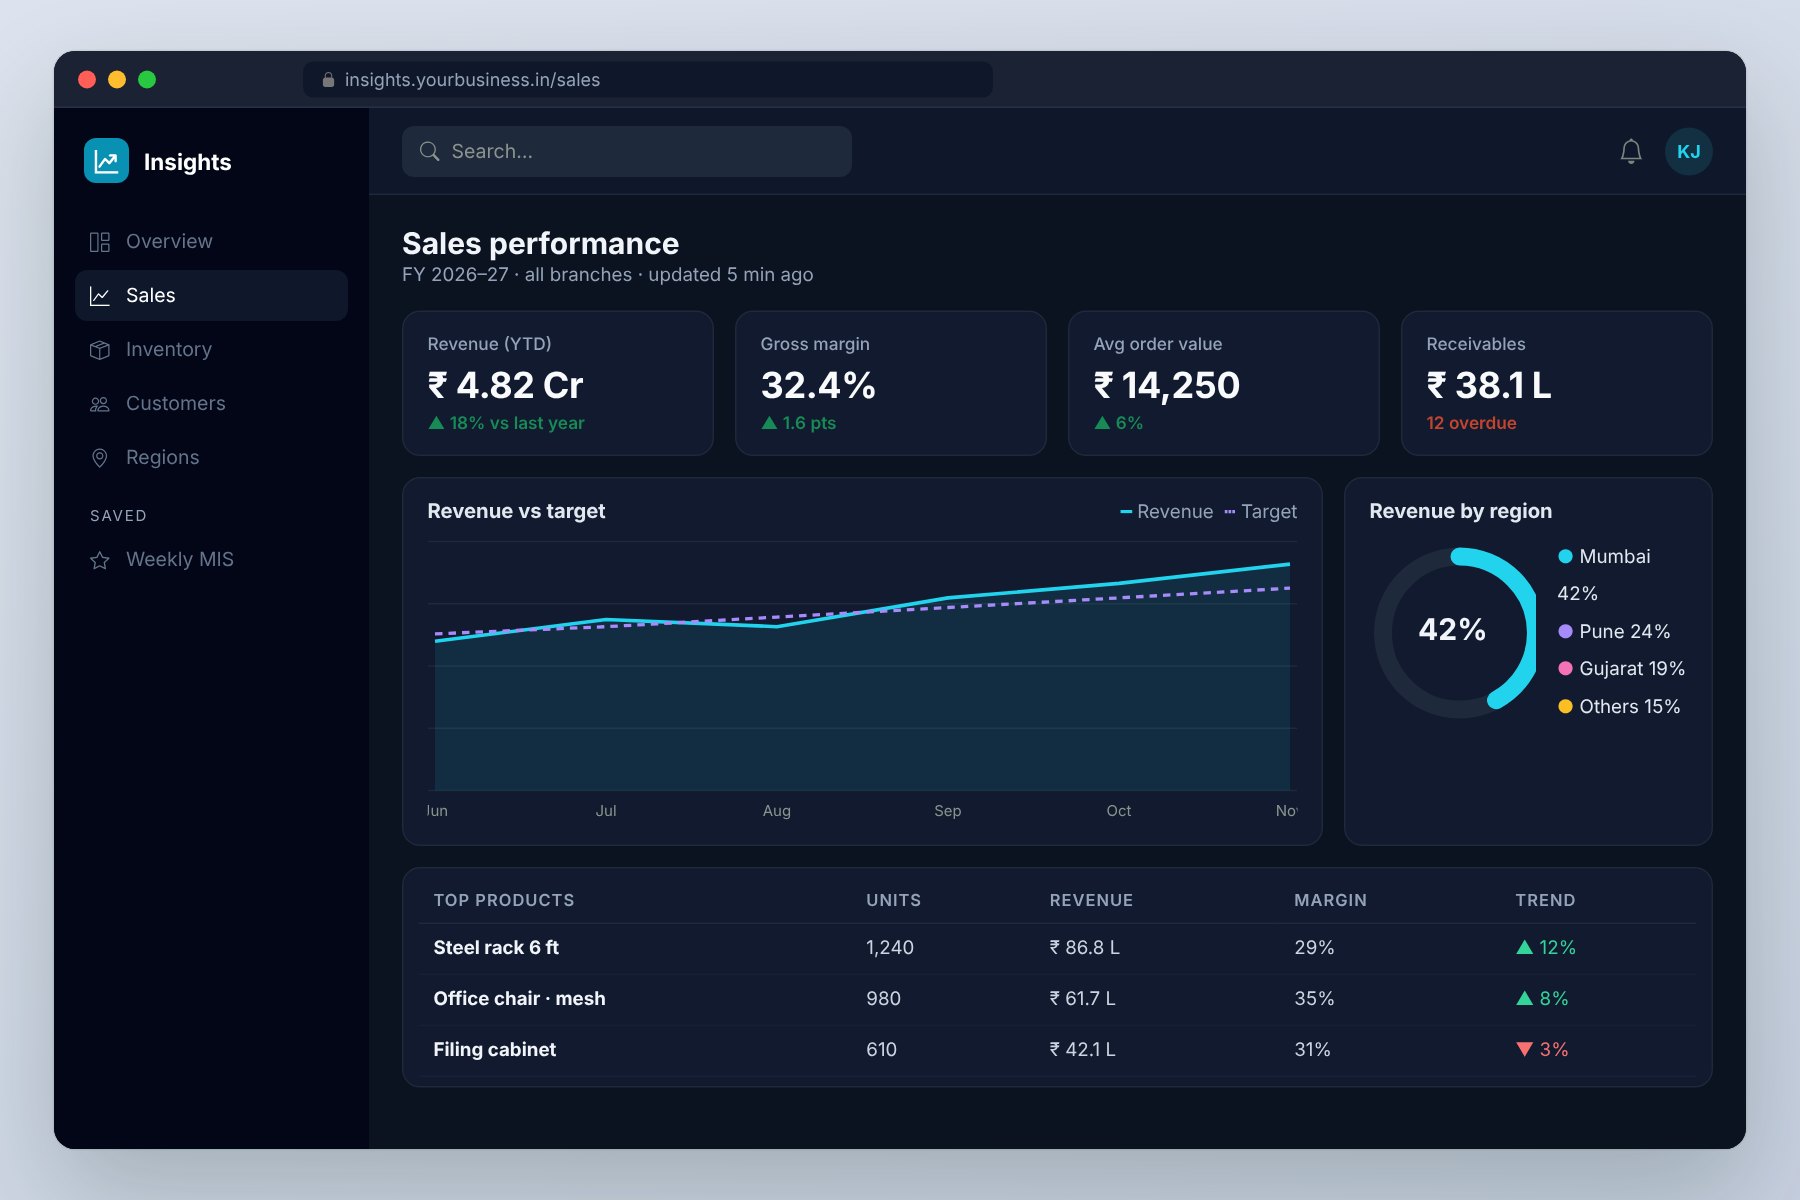
01Why dashboards beat spreadsheets
Most businesses have plenty of data - in billing, Tally, CRM, spreadsheets and other systems. The problem is turning it into answers. When reports are prepared manually, they arrive late, contain errors and differ between departments. Dashboards connect directly to your data, refresh automatically and show the numbers that matter in a way everyone can understand.
02What we build
- Power BI dashboards for sales, finance, inventory and operations.
- Sales analytics by product, customer, region and salesperson.
- Financial analytics for revenue, expenses, receivables and profitability.
- Inventory analytics for stock levels, ageing and movement.
- Excel automation for recurring reports.
- MIS reporting for management reviews.
03How we deliver
We start by agreeing the questions your dashboards must answer and the KPIs behind them. Next we connect and clean data sources, build a data model and design dashboards. After review and refinement, we set up automatic refresh and train your team.
04What affects cost and timeline
The number of data sources, data quality, number of dashboards, refresh frequency and licensing needs (for example Power BI licences) affect effort.
05Common use cases
Typical projects include owner dashboards with daily sales and collections, sales team performance tracking, inventory health reports and monthly MIS packs that used to take days to compile.
06Mistakes to avoid
Avoid building dashboards before agreeing KPI definitions, connecting messy data without cleaning, and cramming too many charts onto one page. We define metrics first and keep each dashboard focused.
07Data quality and governance
Dashboards are only trusted when the numbers behind them are consistent. We document how each KPI is calculated, clean duplicate or inconsistent records at the source where possible, and set up checks that flag missing or unusual data after each refresh. Access is role-based, so salespeople see their own territory while management sees the full picture.
As needs grow, the same data model supports new dashboards, forecasting and integration with AI tools without starting again.
We also train your team to read and use the dashboards confidently: how to filter by period or region, drill into details, export data and spot trends that need attention. A short review after the first month helps refine charts and add the views people ask for most, so the dashboards become part of everyday decision-making rather than a report nobody opens.
Where it helps, we add scheduled email summaries and alerts - for example when collections drop, stock falls below a threshold or a target is at risk - so important changes reach the right person without anyone having to check the dashboard first.
08Rollout, training and long-term care
Launching data analytics & dashboards is the start of the journey, not the end. Every project includes a planned rollout: we agree which users and processes go first, prepare clear guides and walk each team through the screens they will use every day. Typical deliverables include reporting needs and KPI definition, data source connection and cleaning, dashboards and reports, so nothing important is left undocumented.
After go-live we stay available for questions, fixes and improvements. Our AMC and maintenance plans cover updates, monitoring and small enhancements, and we review usage with you periodically to recommend the next most valuable step. This steady, phased approach keeps risk low and makes sure the solution continues to match how your business works as it grows.
09Do you need dashboards?
- Weekly reports are prepared by hand.
- Departments argue about whose numbers are right.
- Your data sits in several systems.
- You want a quick daily view of the business.
10Why choose JMDA for Data Analytics & Dashboards
JMDA Analytic Pvt Ltd brings 18+ years of industry experience - 13 years as a service provider, 4 years as a proprietorship and now as a private limited company - and more than 200 completed projects for Indian and international clients. That experience matters for data analytics & dashboards, because most problems are not purely technical: they come from unclear requirements, changing priorities and systems that were never designed to work together.
For this service we typically work with owners who want a daily business view, sales and finance teams, companies with data in many systems and teams living in excel. Our team understands how these businesses operate day to day, which helps us design features such as power bi dashboards, sales analytics, financial analytics around real workflows rather than assumptions. Because our developers, designers and project managers work together from our office in Goregaon West, Mumbai, you always have a direct line to the people building your solution.
Three principles guide every engagement:
- Clarity before code. Discovery and Design come first, so you approve screens and receive a fixed quote before development begins.
- Visible progress. You see working software at the end of every sprint and can change direction early, when it is still inexpensive.
- Long-term partnership. After go-live, our AMC and maintenance plans keep your data analytics & dashboards secure, fast and aligned with how your business grows.
We are also comfortable working with what you already have. If you use Tally, an existing CRM, a legacy database or third-party tools, we plan integrations and data migration during Discovery so nothing important is lost. And if a ready-made product would serve you better than a custom build, we will tell you honestly.
The easiest way to find out whether we are the right partner is a free, no-obligation consultation. Share your requirement through the quote form or WhatsApp, and we will come back with practical questions, a suggested approach and an estimate of the next steps.