One platform to run the whole business of Nefcon Systems
How we built a custom ERP, CRM, service and analytics platform for a Mumbai home-automation and motorised-curtain company, from the first enquiry to the last rupee collected.
A complete digital backbone for a growing product company
Nefcon sells and installs smart-home products (motorised curtains, curtain tracks and motors, smart control panels and retrofit modules) through dealers, distributors, a field sales team and direct customers. JMDA designed and built the software that now runs this business end to end.
- Client
- Nefcon Systems Private Limited, Malad West, Mumbai (incorporated April 2021)
- Industry
- Home automation, motorised curtains and blinds, smart control panels, Wi-Fi / Zigbee retrofit modules
- Sales channels
- Dealers and distributors (B2B), direct clients, field sales team, website enquiries
- Engagement
- Custom ERP + CRM + service management + website + analytics, designed, built and maintained by JMDA Analytic
- Portals
- Orders & operations · CRM · Repair & replacement · Payment (INV) portal · Public website
- Intelligence layer
- Real-time CEO / MD dashboard and an AI inventory dashboard built with machine learning and deep learning (neural-network forecasting, k-means clustering, Isolation Forest anomaly detection, root-cause and transfer optimisation)
- Technology
- Python · Django · PostgreSQL · Bootstrap · Chart.js · numpy-based ML · AWS EC2 (Ubuntu, Apache)
How Nefcon's business works
Nefcon is a product-and-installation business. Every sale mixes standard catalogue items with made-to-measure work, so the software has to understand sites, measurements, stock in several warehouses and long dealer relationships.
What it sells
- Motorised curtain motors and tracks (straight, curved, extendable)
- Smart control and display panels
- Wi-Fi / Zigbee retrofit modules: dimmers, curtain modules
- Blinds, accessories, installation and service
Who buys
- Dealers and distributors across states
- Interior designers, builders and direct home owners
- Leads from exhibitions, references, online marketplaces, website and cold calls
How it delivers
- Several warehouses, including a dedicated install store
- Site measurement → quotation → approval → packing → checking → dispatch → accounts
- Repairs, replacements and OEM returns after sale
The journey of one order
What makes this business hard to run on spreadsheets
Made-to-measure quoting
Curtain tracks are cut to the room: track length, side and centre tracks, gearbox, runners, ceiling clamps, jointers, 90° and 135° bends. Every quotation needs these measurements, and they drive the raw material used.
Several warehouses
The same item sits in different warehouses, moves between them, is used as raw material, returned, found or lost in counts. Stock and cost must stay right per warehouse.
Shared dealer credit
Several salespeople can work the same dealer. Business has to be credited by agreed percentages per dealer per month, fairly and the same way in every report.
Two sets of books
Dealer, vendor and management transactions are kept in two ledgers (EST and INV), and management needs one combined view of what every dealer owes.
Requirements that shaped the platform
The brief was not “a CRM” or “an inventory tool”. Nefcon needed every team (sales, accounts, warehouse, service and management) working on the same live data.
| Area | Need | How the platform answers it |
|---|---|---|
| Sales | Track every lead from enquiry to client, never miss a follow-up, measure each salesperson's activity and targets. | CRM portal, follow-up engine with missed-follow-up alerts, activity report, daily / monthly targets |
| Quoting | Accurate quotations with site measurements, approval by the client and by management, revisions without losing history. | Quotation module with measurements, client + manager approval, revise / copy / version trail |
| Operations | Clear order stages, packing proof, checking, courier and tracking, no lost or silently deleted orders. | Order workflow with stage owners, packing photos, courier checks, deleted / restored order logs |
| Stock | Correct stock and cost in every warehouse, transfers, raw-material use, physical-count corrections. | Multi-warehouse stock ledger, transfers, found / lost with user, purchase-driven costing |
| Money | Dealer and vendor ledgers in two books, cash and expenses, payment confirmation, one view of outstanding. | EST and INV ledgers, payment OTP, wallet, combined INV + EST outstanding report |
| Service | Repairs and replacements tracked with technicians, photos, couriers and OEM stock. | Repair & replacement portal |
| Management | Real-time view of the business with clear recommendations, not 40 separate reports. | CEO / MD dashboard and inventory dashboard with AI |
One record, entered once, used everywhere. A quotation becomes the order, the order moves the stock, the stock movement values the inventory, the invoice posts to the ledger, and every report reads the same rows.
One platform, five portals
Each team gets its own web address and screens, but all portals share one database and one set of business rules. A routing layer sends each user to the right portal by domain, so a dealer, a salesperson and the accountant each see only their part.
Orders & Ops
Quotations · orders · stock · purchases · EST ledgers · reports.
CRM
Leads · prospects · follow-ups · targets · activity · announcements.
Repair & Replace
Service requests · technicians · photos · OEM & defective stock.
Payment (INV)
INV dealer ledger · INV vendors · expenses · management entries.
Website
Products · categories · distributors · blogs · enquiries → CRM.
Notifications and integrations
Web push alerts
Browser push notifications (Firebase) and in-app notifications for approvals, follow-ups and announcements.
Email and meetings
Multiple outgoing mail accounts for quotations and reminders; Zoom API for scheduling sales meetings.
Scheduled jobs
Background jobs check missed follow-ups and send follow-up reminders every minute, keeping the sales team on time.
Every team, every step, one record
CRM and sales management
The CRM portal turns every enquiry into a tracked opportunity and makes the sales team's work visible to managers, down to individual calls and meetings.
Lead management
- Leads with source (exhibition, reference, marketplace, website, cold call…), type, classification, sub-category, country / state / city
- Lead approval and rejection by managers
- Google-review proof capture for leads and clients
- Bulk assign and bulk move of leads between salespeople
- Prospects with their own approval and status flow; “do not contact” list for clients
- Distributor-to-salesperson assignment so every dealer has an owner
Targets, tasks and follow-ups
- Sales task names with monthly targets, weights and working days; daily targets per person
- Holiday calendar so targets and reports count working days correctly
- Tasks assigned by managers; announcements with recipients and reminders
- Column-level permissions: managers decide which columns each user may see
- Separate follow-up timelines for leads, prospects and dealers (call, meeting, in-person visit) with comments
- Missed follow-ups detected automatically every minute, with a history of every miss, and reminders before a follow-up is due
| Activity measure | Meaning |
|---|---|
| New / old calls | Calls to leads and dealers: first contact vs repeat |
| New / old meetings | In-person meetings: first vs repeat |
| New leads | Leads whose first follow-up falls in the period |
| QT / Estimate | Quotations and estimates prepared |
| Total connected | Calls + meetings + QT + estimates + business orders |
Quotation to order
Quotations are where Nefcon's made-to-measure business meets the catalogue. The module captures the site, the measurements and both approvals before anything leaves a warehouse.
Quotation
- Customer, site location, enquiry date, courier preference, notes for staff and for the client
- Line items by warehouse with quantity, price, discount %, taxable value and GST
- Site measurements for curtain tracks: actual track length, side and centre tracks, track with gearbox, extra runners, extra ceiling clamps, jointers, pipe and room length, 90° and 135° bends
- Separate QT quotations for leads (CRM) and estimates for existing clients
- Client approval and management approval, each recorded with name and status
- Edit, revise, copy and soft-delete, with the history kept
Raw material and costing
- Measurements feed raw-material entries (track pieces, motors, accessories) consumed from stock
- A temporary cart lets the team build the raw-material list before confirming it
- Each order line stores the purchase cost at the time of sale, so profit stays correct later even when prices change
- Item cost follows the item's purchase type: fixed price, or variable price updated by each purchase
- Imported items use a currency multiplier (RMB) for landed cost
Once approved, the quotation becomes an order and moves through clearly owned stages. Orders can be moved back a stage with a reason, rejected, split, deleted (with a log) and restored.
Proof at every step
Packing photos are attached to the order and to returns; courier changes are logged with old and new courier and a comment.
Stock moves with the order
Approving an order adds to the warehouse's sales quantity; rejection reverses it. Returns add stock back to the warehouse they came from.
Nothing disappears
Deleted and restored orders keep a log of who did it and when, so management can always reconstruct what happened.
Multi-warehouse inventory and purchasing
Every item in every warehouse has its own running stock ledger. Each movement type is a separate column, so the closing stock can always be explained line by line.
# closing stock formula (per item, per warehouse)
Opening + Purchase + Return + Found + Shifting in + Accounts reject
        − Sales − Raw material − Lost − Shifting out  =  Closing
Masters
- Item master: category, sub-category, UOM, HSN, tax %, MRP / selling price, purchase type (fixed or variable), minimum stock, maintain-stock flag, finished good / raw material
- Warehouses with display order; vendors with GST and bank details; departments, groups and sub-groups
Stock control
- Transfers between warehouses with available quantity at the time
- Found / lost entries from physical counts, with the user and a message
- Raw-material consumption linked to the order that used it
- Low-stock report against each warehouse's minimum level
- Closing stock report with drill-down to sales, purchases, returns, raw material, found and lost
Purchasing & valuation
- Purchase invoices with vendor, invoice date and line items per warehouse
- Each purchase adds to warehouse stock and updates the item's latest purchase price
- Purchase-quantity drill-down to the invoices behind it
- Valuation: closing quantity × unit cost (fixed price for “Fixed” items, latest purchase price for all others), the same rule used on every order line
Ledgers, payments and cash
Nefcon keeps two sets of books. The platform runs both side by side and combines them where management needs one answer.
EST books
- Dealer ledger (receipts, payments, bills)
- Vendor ledger
- Management transactions
- Expenses · cash locker · wallet
INV books (payment portal)
- INV dealer ledger (incl. bank entries)
- INV vendor ledger
- INV management transactions
- INV expenses
| Report management relies on | What it answers |
|---|---|
| Management business report | Net business per salesperson for any period (taxable sales minus returns, with install and freight lines excluded) |
| Dealer weighted business report | Business credited to each salesperson by agreed dealer percentages |
| INV + EST combined outstanding | What every dealer owes across both books, with overdue amounts |
| Ledger and monthly cash reports | Dealer, vendor and cash positions over time |
| Sales pipeline and quotation history | Open quotations, approvals pending, conversion |
Repair, website and access
Service requests
- Service request invoices with customer, salesperson, items and status
- Approval types and management approval
- Technicians assigned per order with status, comments and photos
Repairs and couriers
- Repair records with photos
- Courier, tracking ID, two status levels and comments
- Full history of each repair from pickup to return
OEM & defective stock
- OEM replacement lists, invoices and order lines
- Separate OEM item inventory
- Defective item inventory with in, out and closing quantities, kept apart from saleable stock
Website and distributor network
The public website is managed from the same platform: product categories and sub-categories, products, distributor listings, testimonials, milestones, “why choose us”, FAQs, multi-section pages, blogs with images and a contact form. Website enquiries arrive as data the sales team can act on.
Users, roles and access
Staff log in with their mobile number. Each user has a role (management, sales person, sales manager, packaging, accounts, lead manager, developer and others), department and warehouse. Screens, approvals and dashboards check the role; managers can switch features on or off per user and hide table columns. Dealers and clients have their own logins and see only their own information.
The rules that make every number agree
Software for a real business is mostly rules. These are the core rules JMDA encoded so that sales, accounts and management always see the same figures.
| What counts as “business” | Detail |
|---|---|
| Taxable value, not invoice total | Business is measured on the taxable value of order lines; GST is excluded. |
| Install and freight excluded | Lines whose item is in the Install category, and freight / service items, are left out of sales figures. |
| Only real orders | Deleted and Rejected orders are excluded; only sales document types count. |
| Returns netted off | Bill and cash returns are subtracted to give net business. |
| Rounded per line | Each line is rounded to the rupee before adding, so totals match the printed reports exactly. |
| Stock and cost | Detail |
|---|---|
| Stock per warehouse | Every movement is posted to the warehouse it happened in; transfers post out of one and into another. |
| Cost at the time of sale | Each order line stores the unit purchase cost when sold, so margins stay correct after prices change. |
| Latest purchase price | For variable-price items every purchase updates the item's cost; fixed-price items keep their set cost. |
| Stock items only | Valuation and stock health include items marked “display” and “maintain stock”, the same default as the stock report. |
Weighted dealer credit
When more than one salesperson works a dealer, management sets a percentage for each person, per dealer, per month. Every sale and return of that dealer is then shared using three rules, applied in order:
Senior accounts
Orders created by designated senior accounts are credited 100% to them.
Agreed percentages
If the dealer has weightage rows for that month, each salesperson gets their %. If they add up to more than 100 they are scaled down; any remainder goes to a designated account.
Default
With no weightage set, the person who created the order gets 100%.
| Sales activity | Detail |
|---|---|
| New vs old contact | A call or meeting is “new” when it is the first contact with that lead or dealer; later ones are “old”. |
| New lead | Counted in the period of its first follow-up, not when it was typed in. |
| Missed follow-up | A follow-up past its due time without an update is marked missed and kept in history, even after it is done later. |
| Total connected | New + old calls + new + old meetings + QT + estimates + business orders. |
| Workflow and control | Detail |
|---|---|
| Two approvals | A quotation needs client approval and management approval before it can become an order. |
| Stage ownership | Each order stage belongs to one team (order check, packing, checking, tracking, accounts). |
| Reversible, never silent | Moves back, rejections, deletions and restores are allowed, and logged with user and time. |
| Reason required | Moving a warm lead back to cold needs a written reason. |
CEO / MD dashboard and inventory dashboard
A single live page for the CEO and Managing Director. It reads the same data and rules as the reports, updates every minute, and turns numbers into actions.
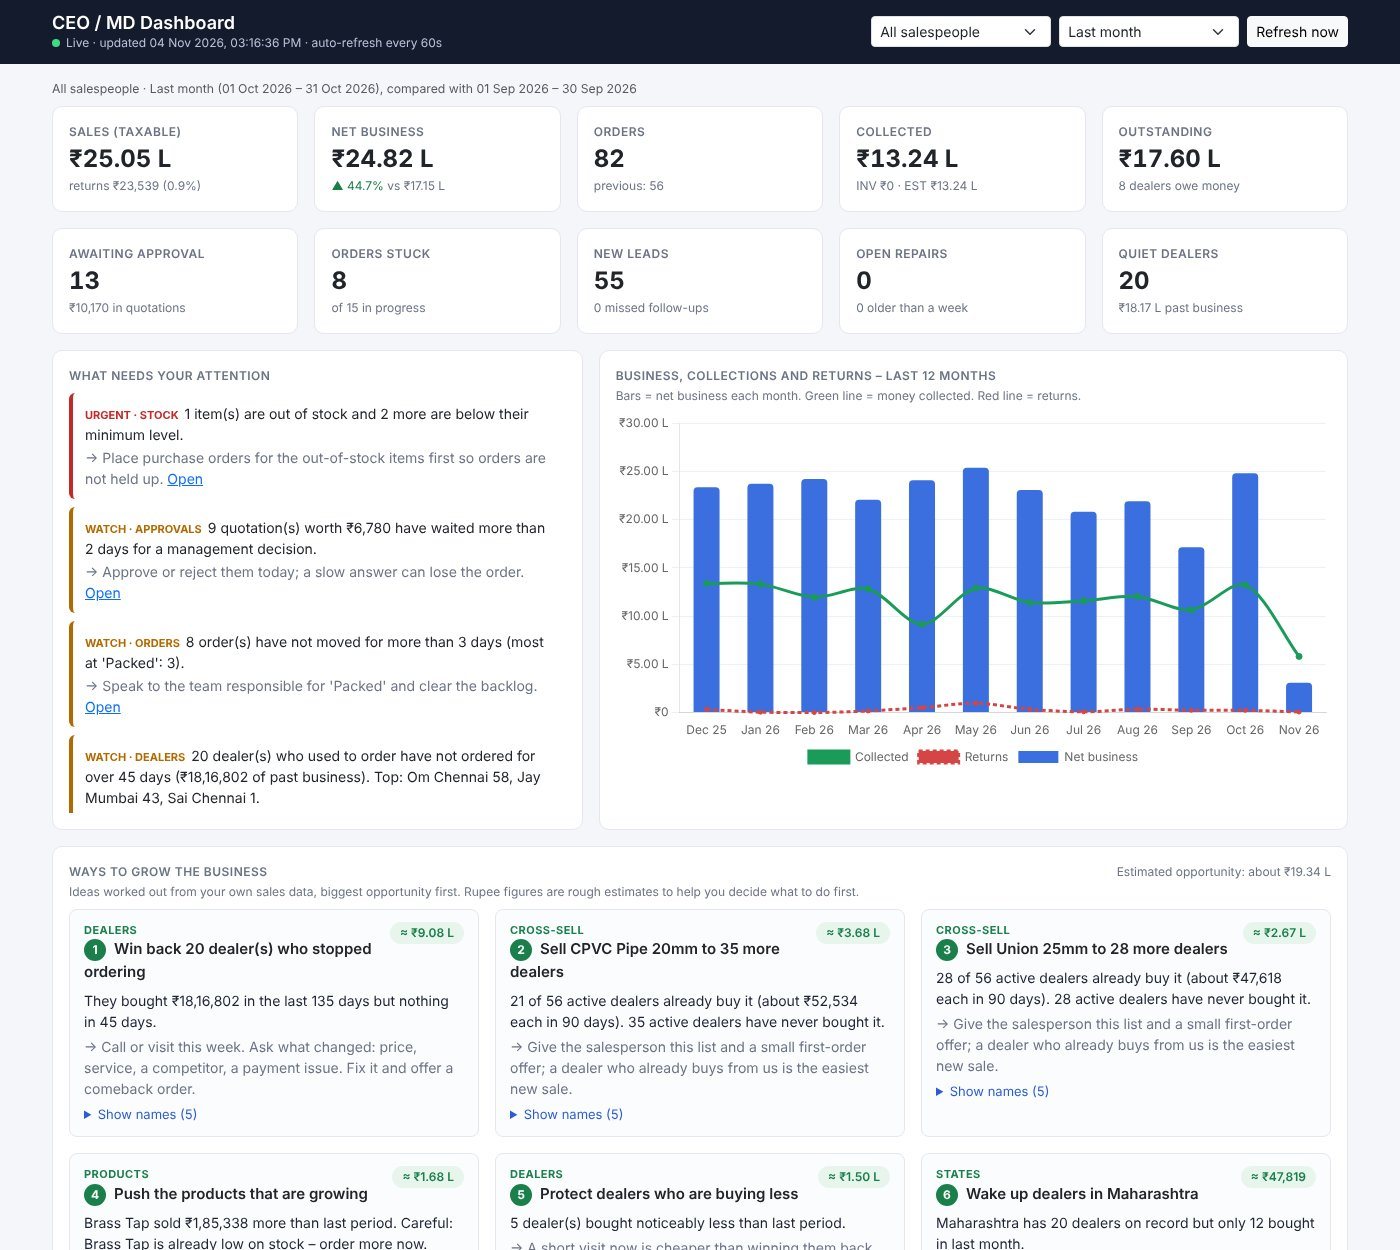
Live numbers
Sales (taxable, minus install), net business, orders, collections, outstanding, approvals waiting, stuck orders, leads, repairs and quiet dealers, for all salespeople or one.
What needs attention
Rule-based alerts: sales drops, returns, approvals waiting, orders not moving, big outstanding, quiet dealers, missed follow-ups, stock-outs, each with the action and a link.
Ways to grow
Cross-sell lists, win-back lists, quotation conversion gaps, discount leakage, product and dealer movers, state and lead-source opportunities, ranked by rupee impact.
More on the CEO / MD dashboard
- Salesperson performance: weighted business, change vs last period, orders, returns, outstanding, missed follow-ups, plus the activity-report columns
- Individual view: pick one salesperson and every figure switches to their weighted share
- Activity log: what every user did today, with a timeline, hourly chart and list of staff with no entries
Charts and safety
- 12-month business, collections and returns; “are we ahead of last period”; quotation ageing; orders by stage; top outstanding; returns; low stock
- Read-only and safe: no tables or migrations; access limited to Management and Developer roles
- Tested: automatic checks confirm the figures match the existing report functions
Inventory dashboard with machine learning
Built around 150 questions the CEO and MD ask about stock: 101 answered in full, 24 partly, and the remaining 25 listed as data the business should start capturing.
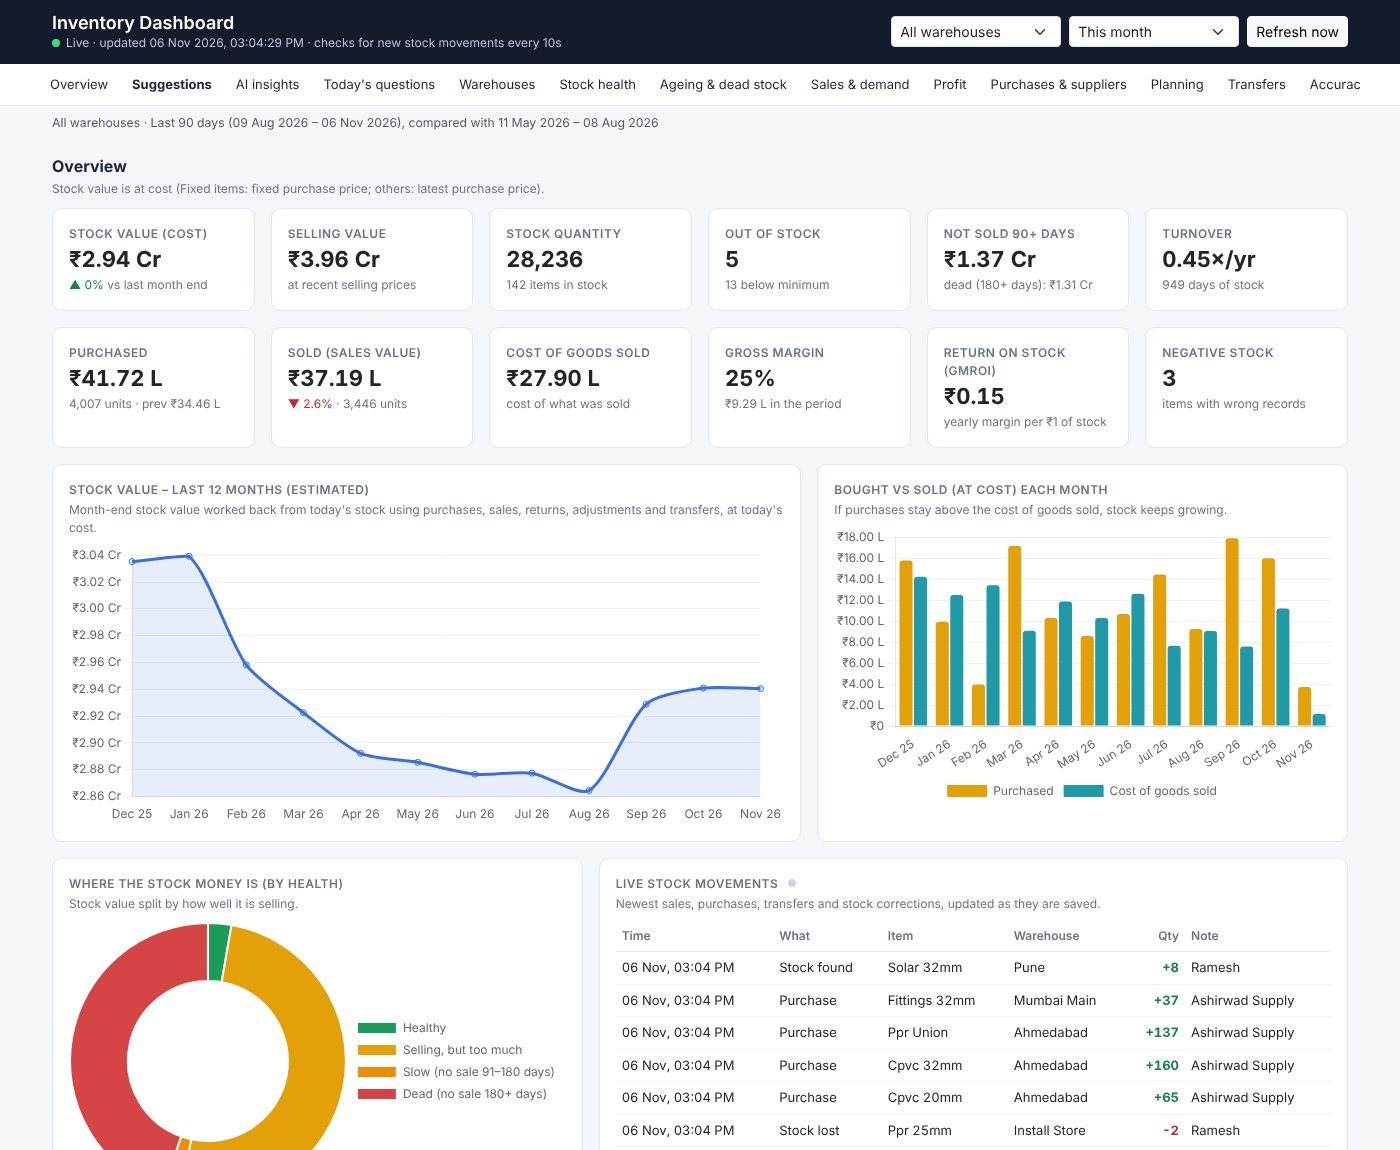
Overview & capital
Stock value at cost and selling price, 12-month value trend, purchases vs cost of goods sold, turnover, days of stock, GMROI, where the money is by health.
Warehouses
All warehouses side by side with a 0–100 health score; best and weakest warehouse; workload, accuracy and transfers.
Stock health & ageing
Out of stock, below minimum, will run out in 30 days, excess, negative stock; FIFO age of stock; days since last sale; dead stock.
Sales, profit, suppliers
Top / bottom sellers, growing and declining items, seasonality, margin by product, cheapest supplier per item, price increases.
Planning
Buy now, order within 30 days, stop buying, 30 / 60 / 90-day purchase budget, pending quotations short of stock.
Control
Stock register, transfers, found / lost by user, operations and people, live movement feed, 150-question guide.
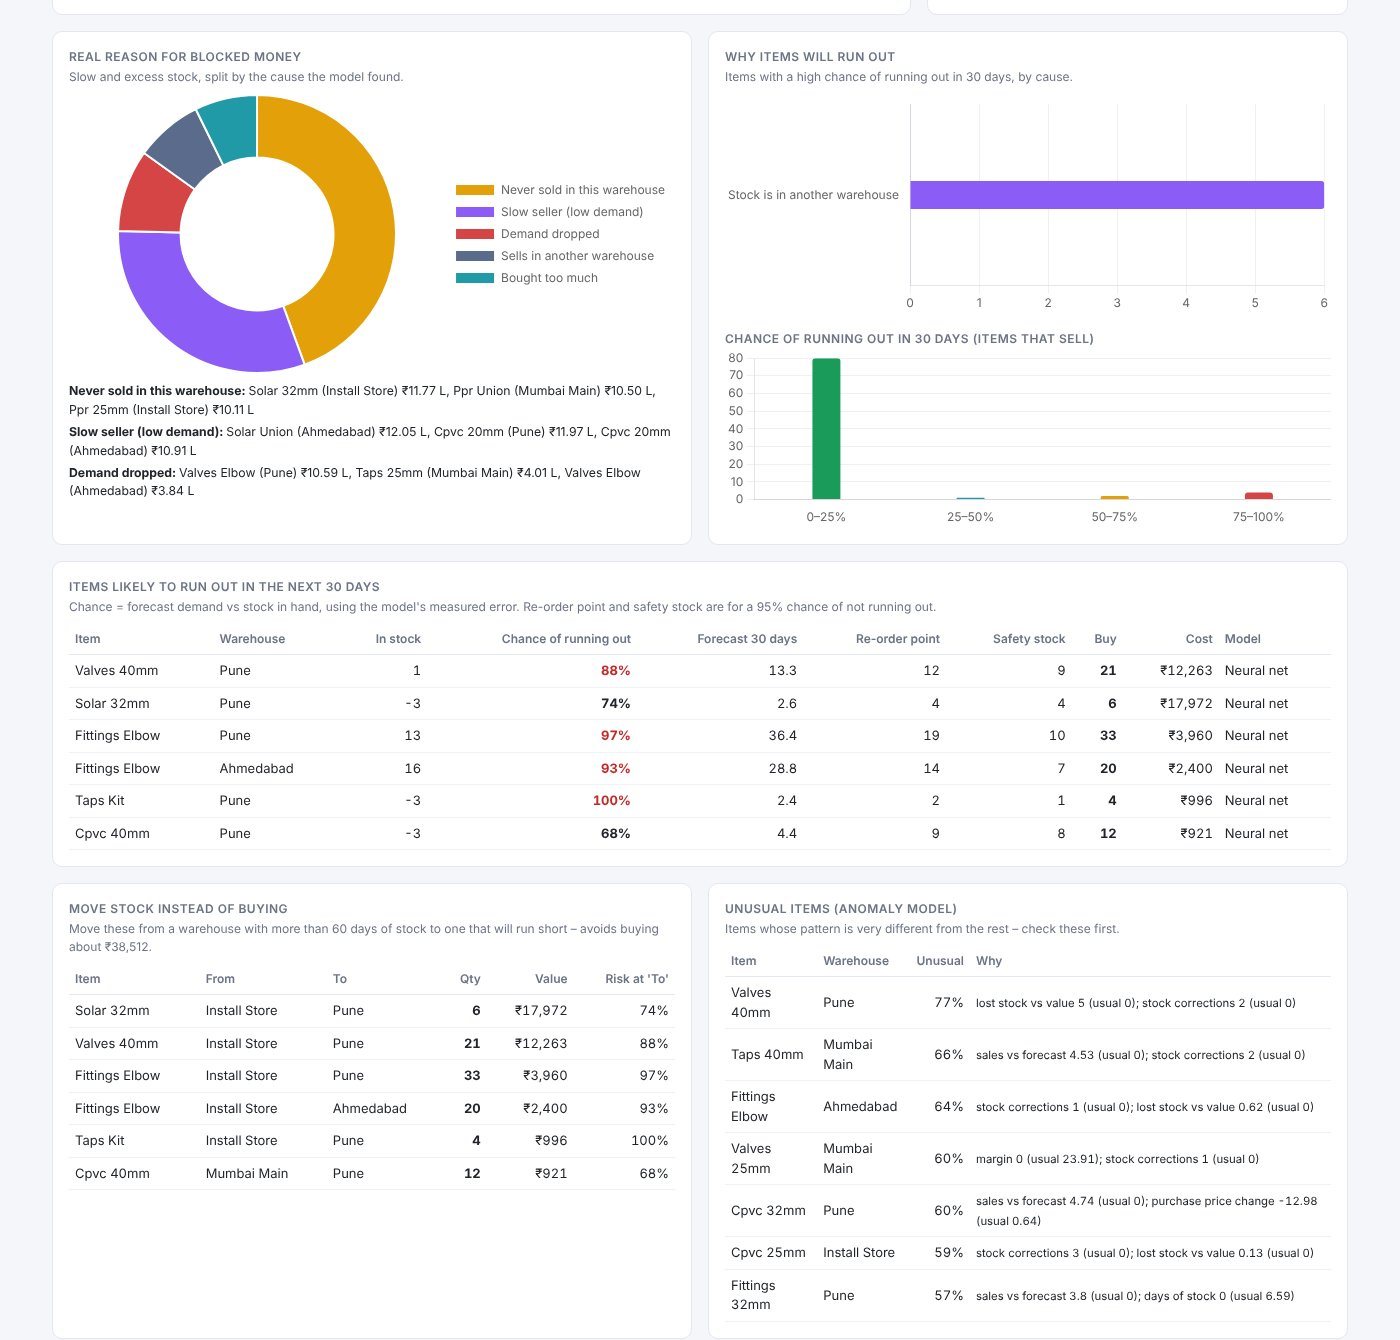
Built with machine learning and deep learning
The inventory dashboard is not a set of static reports. It contains trained models (a deep neural network, clustering and anomaly detection) that learn from Nefcon's own sales history and combine with live stock to tell management what will happen and what to do.
| Management question | AI technique | Output on the dashboard |
|---|---|---|
| How much of each item will we sell in the next 4, 8 and 12 weeks? | Deep neural network (deep learning) | Demand forecast with a likely range |
| Which items will run out in the next 30 days? | Probabilistic forecast | Chance of running out (%) per item and warehouse |
| How much should we keep and when should we order? | Forecast error → service-level maths | Safety stock, re-order point, buy quantity |
| Which products are stars, which are cash traps? | k-means clustering (unsupervised ML) | Five product groups with stock value |
| Is anything unusual: losses, corrections, price jumps? | Isolation Forest (anomaly detection) | Ranked list of unusual items with reasons |
| Why is money stuck, why do items run out? | Root-cause engine on model features | Causes with rupee value and examples |
| Can we move stock instead of buying? | Forecast-based transfer optimisation | Transfer plan: item, from, to, quantity, value |
From data to decisions
Deep learning demand forecast
Instead of a separate guess per product, one global deep neural network learns from the sales of every item in every warehouse together. Items with little history benefit from patterns learned on similar items.
| Design choice | Detail |
|---|---|
| Architecture | Multi-layer perceptron: 20 inputs → 64 → 32 → 3 outputs (average weekly demand over the next 4, 8 and 12 weeks), ReLU activations |
| Training | Mini-batch Adam optimiser; Huber loss so one unusually large order does not distort learning; L2 regularisation; early stopping on a 15% validation split |
| Training data | Sliding 12-week windows from 104 weeks of sales per item and warehouse, returns netted off; the current, unfinished week is left out |
| Scaling | Each series is scaled by its own average so fast and slow items train together |
| Seasonality | Week-of-year encoded as sine / cosine so the network can learn festive and seasonal peaks |
| Built with | numpy only: no heavy framework to install on the client's server |
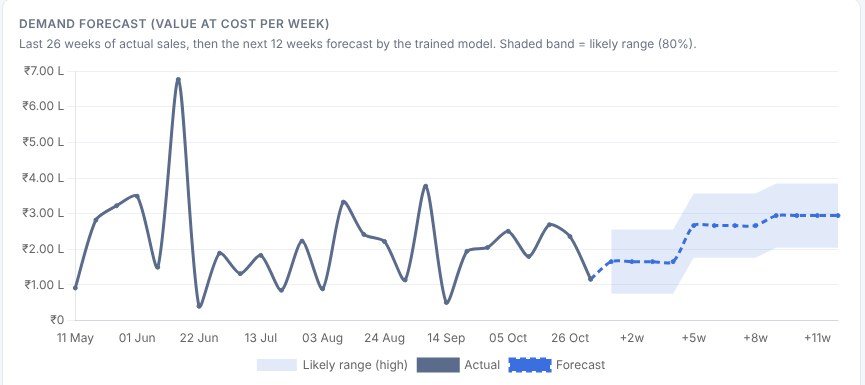
Every model must earn its place
Hold out: the last 12 weeks are hidden during training. Compete: the neural network, a 12-week average and Holt trend smoothing each predict those weeks. Choose and show: errors are measured (WAPE), the best model per demand type is used, and the dashboard shows every model's error in plain words. If the neural network is not better on Nefcon's data, the dashboard says so and uses the simpler model.
From forecast to stock-out risk and safety stock
| Calculation | How |
|---|---|
| Expected 30-day demand | Forecast weekly demand × 30 / 7 |
| Uncertainty | The model's own back-test error for that item, scaled to 30 days |
| Chance of running out | Probability that 30-day demand exceeds the stock in hand (normal distribution) |
| Safety stock | 1.65 × error × √(supplier lead time): about a 95% chance of not running out |
| Re-order point | Forecast demand over the lead time + safety stock |
| Buy quantity | 30 days of forecast demand + safety stock − stock in hand |
Product groups with k-means clustering
Every item in every warehouse is described by six features: stock value, days of stock, days since last sale, margin, demand swings and trend. k-means (k-means++ start, several runs) groups similar items, shown as a bubble chart of speed of sale vs margin, with bubble size = money in stock.
Stars
Fast and profitable: must never run out.
Steady sellers
Predictable demand: normal re-order rules work.
Erratic demand
Jumps up and down: keep central stock, order smaller.
Cash trap
Slow and high value: stop re-ordering, clear stock.
Dead / not moving
No recent sale: liquidate and remove from range.
Anomaly detection with Isolation Forest
An Isolation Forest of 150 random trees looks at six signals for every item and warehouse: stock corrections, lost stock compared with stock value, purchase price change, margin, recent sales against forecast, and days of stock. For each unusual item the dashboard explains the reason in plain words, for example “5 stock corrections in 180 days (usual 0)”.
Transfer optimisation
For every item likely to run out, the system looks for warehouses holding more than 60 days of that item's forecast demand and proposes a transfer: item, from, to, quantity and the purchase value avoided. Only true surplus is moved.
Root cause: why money is stuck in slow stock
- Never sold in this warehouse: stock sent to the wrong place
- Bought too much: purchases in 180 days more than twice the sales
- Sells in another warehouse: demand exists elsewhere
- Demand dropped: recent sales far below earlier months
- Slow seller: genuinely low demand
Root cause: why items will run out
- Stock is in another warehouse: transfer, don't buy
- Demand jumped: recent sales well above forecast
- Re-ordered too late: no purchase within lead time + 30 days
- Not enough stock planned: re-order levels too low
Suggestions for the CEO and MD
Each suggestion states the rupee impact (as a rough guide), why it matters, the exact items or warehouses, who should act (purchase head, warehouse in-charge, sales head, accounts, MD) and by when (today, this week, this month).
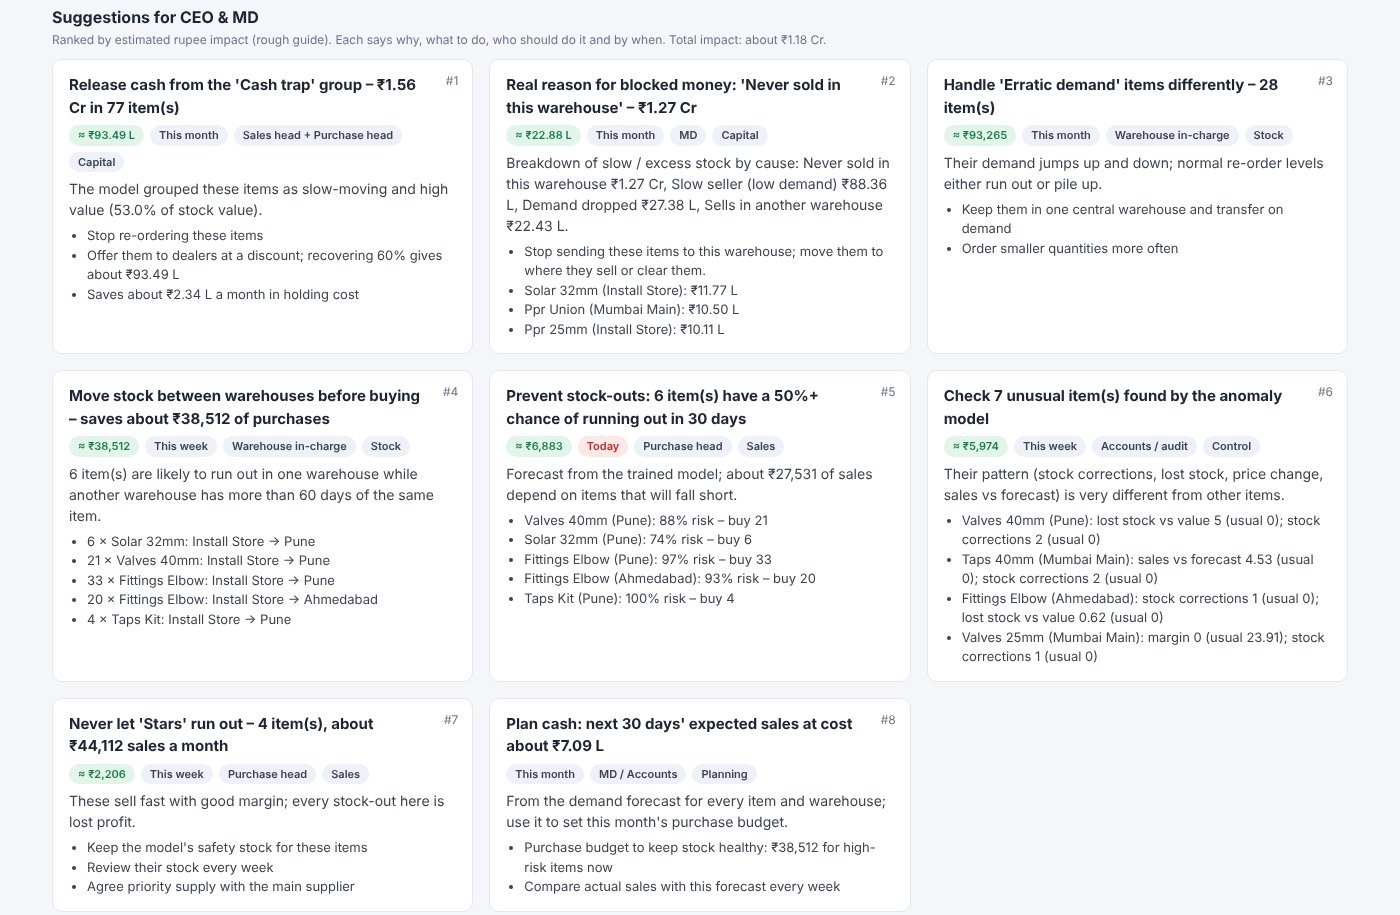
Typical suggestions
- Move stock before buying: items about to run out in one warehouse while another holds more than 60 days of them
- Prevent stock-outs: items with a 50%+ chance of running out in 30 days, with quantity to buy
- Real reason for blocked money: the biggest cause of slow stock and the policy that fixes it
- Release cash from cash traps: stop re-ordering, clear at a discount
- Protect the stars: fast, profitable items that must never run out
- Check unusual items: anomalies for audit; plan next month's cash from the forecast
Real-time engine (seconds)
- The page checks a light “fingerprint” of the stock tables every 10 seconds
- Only when something changed are the figures rebuilt
- One rebuild is shared by every viewer, so the server is not overloaded
- A live feed shows each new movement as it is saved
Automatic re-training (hours)
- Models re-train in a background thread every 6 hours; the page never waits
- A lock ensures only one training runs at a time across web workers
- Results are saved to a model file; the database is never written to
- Training can also be run by hand or scheduled nightly
Responsible AI by design
| Principle | How it is applied |
|---|---|
| Transparent | Every model's accuracy is shown; every anomaly and cause comes with a plain-language reason. |
| Humble | Simpler models are used where they win; rupee impacts are labelled as rough guides. |
| Safe | Read-only on business data; access limited to Management and Developer roles. |
| Private | Trained on the client's own data on the client's server; saved model files hold only numbers per item and warehouse. |
| Resilient | If the AI cannot run, the rest of the dashboard keeps working and says why. |
| Tested | Automatic checks confirm the network learns a known pattern, clustering and anomaly detection behave correctly, and stock-out risk, causes and transfers are right on test data. |
Technology and architecture
| Layer | Choice | Why |
|---|---|---|
| Application | Python, Django 4.2 (LTS) | Mature, secure framework; fast to build data-heavy business screens |
| Database | PostgreSQL | Reliable transactions for orders, stock and ledgers |
| Front end | Server-rendered pages, Bootstrap 5, jQuery / Axios, DataTables, Chart.js | Works on office PCs and phones without an app install |
| Portals | Domain-based routing middleware over one code base | Separate experiences per team, one source of truth |
| Jobs & alerts | Cron jobs, Firebase web push, SMTP mail, Zoom API, OTP | Reminders and confirmations without manual effort |
| Analytics & ML | Read-only dashboard apps; numpy neural network, k-means, Isolation Forest | No extra packages; models trained on the client's own data |
| Hosting | AWS EC2 (Ubuntu, Apache) | Scalable cloud hosting under the client's control |
Shared rules, not copied rules
Dashboards call the same calculation functions as the reports, so a change in a business rule updates every screen.
Add-on modules
New capabilities, such as the two dashboards, are delivered as self-contained folders that plug in with two lines of configuration and can be removed just as easily.
Read-only intelligence
Analytics never write to business tables; automatic checks confirm that no insert, update or delete is issued.
How JMDA delivered
Discover the real process
Sit with sales, warehouse, accounts and service; map how a curtain order really moves, including the exceptions.
Build module by module
Operations first, then CRM, payment portal, service and website, each going live while the next was built.
Encode the business rules
Agree each rule (what counts as business, weightage, costing) with management and build it once in shared functions.
Review and strengthen
Structured code reviews (a full system analysis and a technical audit with a scorecard and roadmap) so the platform keeps pace with the business.
Plain-language handover
Developer instructions written in simple words with the “why” behind each change, plus sandbox testing before anything reaches the live server.
Add intelligence
Real-time dashboards and machine learning on top of the data the platform already captures, with honest accuracy reporting.
Results and value for Nefcon
The value of the platform is that the whole company now works from one live record, and management can see, and act on, the business as it happens.
Every lead and follow-up tracked
Leads, prospects and dealers each have an owner, a follow-up timeline and automatic missed-follow-up alerts. Managers see calls, meetings, quotations and orders per salesperson in one report.
Quote-to-cash in one flow
Measurements, approvals, packing photos, checks, courier tracking and accounts are steps of one order, with a log of every move back, deletion and restore.
Stock that can be explained
Each warehouse's closing stock is broken down by movement type, valued with a consistent cost rule and checked by found / lost counts tied to the person who made them.
One view of what dealers owe
Two sets of books run side by side, with a combined outstanding view and OTP-confirmed payment entries.
Agreed credit for shared dealers
Weighted dealer credit is calculated the same way in the dealer report, the CEO dashboard and the salesperson table.
Decisions in real time
The CEO / MD and inventory dashboards update within a minute (stock within ~10 seconds) and list concrete actions with owners and deadlines.
What comes next
| Initiative | Value |
|---|---|
| Platform hardening | Continue the security and quality roadmap from the technical audit: secrets management, access checks on every screen, automated tests, Python upgrade. |
| Serial-number traceability | Track each serialised motor or panel from purchase to customer, transfer, repair and warranty. |
| Transfer workflow | Dispatch and receive steps for warehouse transfers, with pending status and timing. |
| Purchase order dates | Order and receipt dates to measure supplier lead times and on-time delivery. |
| Daily stock snapshots | A nightly stock snapshot for exact historical stock value and ageing. |
| Mobile experience | Faster mobile screens for field sales and technicians. |
| More AI | Sales forecasting per dealer, churn prediction for quiet dealers, quotation win-probability scoring and price-optimisation models on the same ML foundation. |
Want one platform for your whole business?
Talk to JMDA Analytic about custom ERP, CRM, inventory and service software, with real-time dashboards and AI on your own data.
This case study describes capabilities delivered and verified in the code. Dashboard screenshots use sample data. Business outcome figures (for example time saved or stock reduced) will be added once measured over a full period with Nefcon.